Chapter 3
Foundations of Security Analysis
Bottom Line Up Front
Whether conducted by practitioners or academics, security analysis embraces the foundations of social science research and analysis. This chapter summarizes this foundational material, providing the social science basics all security analysts should know. This research and analysis approach mirrors the scientific method, which combines empiricism (evidence, data) and rationalism (logic, reasoning). This approach can be used to study security-related human behavior, human decision making, and human conditions. Key topics include epistemology, structure of science, research design, and sampling theory. Security analysts should comprehend these topics and employ the Security Analysis Critical- Thinking Framework, a synthesis of the scientific method and critical thinking in their analyses. The chapter concludes with several “Great Debates,” which highlight areas where disagreements remain among social science researchers.
Confusing Vocabularies
One of the first things encountered in the larger research and analysis literature is the lack of standardization in vocabularies. Security analysts face a jumble of often conflicting research and analytic terms. Differing agencies, analytic communities, and academic disciplines often have their own definitions for research and analytic concepts. These groups also often disagree about the best ways to process information. Practitioners champion their own organization’s traditional methods of conducting analysis and often do not embrace foundational social science concepts in this chapter. Academic disciplines often impart their own spin on social science concepts and methods. Practitioners and academics often confuse each other by using different definitions and terms meaning the same things. The confusion created by the use of different concepts and definitions results in practitioners and academics often “talking past each other.” To improve security analysis, practitioners and academics should acknowledge the differing terminologies. This chapter provides tools for analysts without a background in social science research methods as well as those needing a refresher on the foundations of social science. It includes important foundational concepts that underpin security analysis for practitioners and academics. A basic understanding of these concepts underlies the critical-thinking material presented throughout this book.
How Do We Know What We Know?
Security analysis creates knowledge either to add to the field’s knowledge base or to provide intelligence and recommended options to decision makers. Epistemology, the study of knowledge, provides a starting point to understand the foundations of security analysis. Epistemology investigates where knowledge comes from.1 If a person could go back and classify every piece of knowledge they possess, it would come from one of the below seven categories. Any individual’s knowledge is a combination of material from all these categories.2 An initial step in analyzing how a person’s belief systems influence their behaviors is to uncover the most significant sources of their knowledge on the problem or decision under study.
Authority. This category of knowledge occurs when an expert or someone in authority (president, dictator, minister, teacher, journalist, parent, etc.) provides the knowledge that a person tends to accept without challenge. This category of knowledge may not be capable of being replicated, which means it often cannot be studied. Much of what is read and heard in the open media about national security and homeland security falls into this category. For example, high-ranking persons often will give their opinions on an issue in a government report, speech, newspaper editorial, television interview, non-academic journal, or other communication; however, there may exist little empirical data or systematic analysis to support the opinions. In some cases, the authority figure will distort the data to support their intended message or agenda, or to deceive the intended audience. Even though some of these opinion pieces may be from highly informed sources, it does not ensure that the message will pass the scrutiny of the scientific method. Therefore, the analyst must be extremely careful about using this often opinion-based knowledge in their formal research and analysis. Chapter 5 provides guidance on assessing information.
Faith. This category of knowledge is at play when a person accepts the knowledge presented with little or no supporting evidence. Most people think of faith knowledge being mainly religious teachings; but, this category encompasses a wide range of knowledge sources. Religious knowledge often is based in “sacred texts” that lack empirical support. Other faith knowledge sources include stories, myths, folktales, rumors, conspiracy theories, political ideologies, cults, and other sources of knowledge or information that lack a solid empirical base. Faith knowledge is often a tool groups use to pass on the stories, myths, and folktales that define the values, ethics, and expected behaviors of their epistemic community. For example, the folktale of lumberjack Paul Bunyan and Babe the Blue Ox in the woodlands of the northern United States and southern Canada addresses community values of personal strength and superhuman labor. Rumors and conspiracy theories usually lack supporting evidence and pander to the confirmation bias tendencies in those who believe them. Political ideologies try to establish community values and define government policy and human behavior. Those following a specific political ideology are highly subject to confirmation bias. Cults usually offer a more or less consistent and tempting belief system not based in evidence and encompass social groups holding a specific ideology (religious, political, etc.) or having common interests in a particular personality, object, or goal. The word “cult” is considered pejorative and often leads to negative consequences. For example, in 1978, Jim Jones’s Peoples’ Temple cult resulted in mass suicide in Guyana; and, in 1993, David Koresh’s Branch Davidians cult was involved in a violent clash with U.S. federal law enforcement in Waco, Texas. Faith knowledge differs from authority knowledge as it usually offers an enticing belief system for its members. Because there is often little empirical basis for faith knowledge, it cannot be replicated to test for validity. Religious ideology and political ideology’s roles in security-related behavior is addressed in more detail in Chapter 6 and Appendix III.
Common Sense. In this category, externally obtained plausible knowledge is presented as if “everybody just knows it.” Common-sense knowledge is usually tied to a person’s overall beliefs, which differ for those with competing belief systems. Chapter 6 provides an expanded discussion of beliefs. Common-sense knowledge is often contradictory and usually too general to be studied. As one saying holds, “Common sense is not all that common!”
Intuition. This is knowledge with no conscious reason for knowing. It usually originates in internal belief systems, sometimes where implicit connections are made through material gained from other knowledge categories—primarily authority, faith, and common-sense epistemologies. Intuition often employs biased facts and poor logic and reasoning. Moreover, intuition is often without a strong empirical basis; that is, people just seem to know (think) it is true. For example, Joseph Stalin used his intuition to conclude there was no chance the Germans would attack the Soviet Union in June 1941— he turned out to be very wrong, resulting in an eventual 25,000,000 Soviet casualties in World War II. Intuition knowledge usually cannot be replicated, thus cannot be assessed for validity. The unaided judgment used in intelligence analysis before 9/11 largely employed intuition to create its findings. Chapter 1 provides an expanded discussion on unaided judgment, and Appendix II reveals the pitfalls of using intuition in complex and high-risk analyses.
Empiricism. This is knowledge gained from a person’s experiences, observations, and gathering of data, facts, evidence, etc., with the five senses or with technical measurement instruments (thermometers, gauges, etc.). To brute- empiricists, only the empirical data matters. Like Sgt. Joe Friday said, “Just the facts, ma'am." (Sgt. Joe Friday was the lead character on the 1950’s and 1960’s TV program Dragnet.) Gathering and assessing empirical information are covered in detail in Chapter 5.
Rationalism. This category of knowledge is generated through humans’ innate abilities to use logic and reasoning that allows a person to reason separately from their actual experiences with the real world. This is the realm of theory discussed in more detail below.
Science (includes social science). This category of knowledge is gained through combining empiricism and rationalism. This category argues that empiricism and rationalism alone may not always be correct; however, if the two are used in tandem, it is more likely to generate knowledge with minimal biases. The scientific method allows the assessment of research reliability and validity. Social science positivists, as defined herein, assume the scientific method may be used to study human behavior, human decisions, and human conditions.3 Security analysis is the application of the scientific method to address security problems. This book takes a positivist approach by combining the scientific method with an even more robust critical-thinking framework.
Creating Science
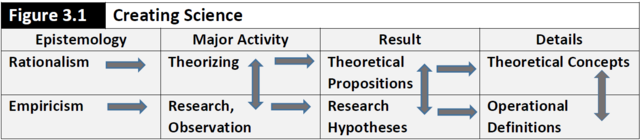
Figure 3.1 is an overview of the major components and processes that combine empiricism and rationalism to create science.4 This figure reveals the major activity of rationalism is theorizing or the use of logic and reasoning. Theories establish relationships expected among variables or concepts; in other words, theories explain how the world works.5 The major activity of empiricism is research, which entails the systematic observation of a phenomenon to advance or test a theory, solve a problem, or inform a decision. Theoretical propositions are statements about the nature of relationships among variables or concepts. Theoretical concepts broadly define the variables or other concepts included in theoretical propositions. When specificity is applied to theoretical propositions, the result is research hypotheses. Specificity in operational definitions allow analysts to measure variables or concepts so research hypotheses may be tested. As depicted below, there are a number of interrelated steps needed to create science. Following discussions provide additional information on the concepts and the structure and processes of science.
Theorizing. This is the employment of logic and reasoning to help understand the world. Theories tend to intimidate students and new analysts as they initially appear as a mystical force they assume will be difficult to learn. This should not be the case! Theories are nothing more than statements of relationships among variables or concepts. They allow the explanation of how the world works, while also allowing analysts to generate predictions. Social theories used in security analysis designate relationships among variables or concepts with a focus on explaining or predicting human behavior, human decisions, or human conditions related to the security field. There are thousands of existing social theories. Some of these are learned in substantive course work, some from reading the security literature, and some will emerge as a study unfolds. There are many theories of security analysis; locating and understanding the structure of theories applying to an analytic project is vitally important in conceptualizing a security study. Chapter 7 provides additional discussion on how theories are used to conceptualize security studies.
Theoretical propositions. Relationships among variables are the main components of theories and are contained in theoretical propositions, which are sentences or statements of relationships between variables. Unfortunately, there is no one literature source that contains most social theories where the analyst may locate the theoretical propositions for their current study. Academic studies often will include a theoretical framework section. More often; though, the literature leaves it to the analyst to “tease out” the actual theoretical propositions. Keep in mind that a major objective of research is to identify, create, test, confirm, revise, and/or discard theoretical propositions.
Another way to think of theoretical propositions is to consider a ball made up of lengths of string. Individual strings make up individual theoretical propositions. See Figure 3.2 for visualizing theory as a ball of string made up of theoretical propositions. The internal strings in the center of the ball represent strong propositions that have received substantial research support. The strings on the outside of the ball represent newer propositions that have undergone initial research support, but require additional testing to confirm their strength and determine if they should be removed from the ball or eventually work their way closer to the center of the ball.
Theoretical propositions, which make up the lengths of string in the Figure 3.2 “theory ball,” take on several forms:6
Assumptions. These entail propositions accepted as true even though they often cannot be proven or disproven. Most theories have a number of assumptions about how the world works—often acting as the “glue” holding together other propositions in the “theory ball.” Many of these assumptions come from the theoretical approach adopted by the analyst. For example, in Marxist theory, it is assumed the structure of a state’s economic system determines its political and social structures. Chapter 6 includes an expanded discussion of assumptions. More on the assumptions underlying Marxism and other political theoretical approaches applicable to security analysis are discussed in Appendix III.
Axioms or theorems. These are propositions taken to be fact (true) as they have been repeatedly supported by logic, reasoning, or mathematical proof, shown as the lengths of string in the center of the ball in Figure 3.2. For example, the Central Limit Theorem in statistical theory allows the analyst to use only one representative sample to infer behavior in a larger population. See further discussion of sampling theory later in this chapter.
Postulates. Postulates are propositions taken to be fact (or true) as they have been repeatedly supported by empirical data (short lengths of string closer to the center of the ball in Figure 3.2). For example, in the literature on the Democratic-Peace Theory, it has been repeatedly supported that no two democratic states have ever gone to war with one another.
Laws. Laws include propositions having withstood so much scrutiny over time they are considered the absolute truth. While the natural sciences have a number of laws, there are very few, if any, laws in social science or security studies. This is due in part to the “free will” of humans to decide on their own behavior or decisions.
Examples of theoretical propositions:
- The greater the economic instability in a state, the lower the political satisfaction. (Political Economy Theory)
- When competing states are both democracies, they will not resort to violent conflict to resolve disagreements. (Democratic-Peace Theory)
- Developed states will exploit undeveloped states to obtain their natural resources and labor at lower costs. (Marxist-Leninist Theory)
- Being a member of an alliance will increase a state’s chances of going to war. (War Prone Systems Theory7)
Theoretical concepts. These concepts consist of abstract symbols or words used to construct theoretical propositions. In other words, theoretical concepts take a broad stab at defining the proposition’s variables. A symbol is an information conveyor whose form is arbitrary and whose meaning is determined by those who use it. This means people rarely deal with reality, but only through symbols (words, numbers, etc.).8 Examples of abstract theoretical concepts:
Economic instability
Developed states
Political satisfaction
Undeveloped states
Democracy
Alliances
Violent conflict
War
Research. In security studies, research entails the systematic social science activities for testing a study’s theory, answering a research project’s questions, or informing decisions. A major focus of these activities is to reduce biases in the research results. Social science research is meant to add to the existing knowledge base on a topic. Security analysis, as a branch of social science, seeks to identify threats and opportunities and provide decision makers recommendations on what to do about those threats and opportunities. The two main purposes of research include:
Pure (basic) research. This research is driven by the interests of the analyst and might or might not have any policy or other effect on the immediate situation. This is research intended to increase the knowledge base on a topic with no immediate effect, except to improve knowledge of how the world works.
Applied research. This research is driven by policy considerations. The intent is to use the research to make changes in the world of social practice, for solving problems, or for making policy decisions. Security analysis, combining intelligence analysis and policy analysis, is largely applied research.
Research hypotheses. This element of research provides specific statements about relationships among variables or concepts, thus allowing them to be studied. Research hypotheses add specificity to theoretical propositions so they may be tested. A traditional social science research hypothesis is simply a sentence or statement that explains how “changes or conditions in one or more independent variables cause changes or conditions in a dependent variable.” In security analysis, research hypotheses may take on a number of additional forms. In intelligence analysis, the hypothesis may define a threat alternative or threat scenario. Intelligence analysts also may outline opportunities that the analyst assesses should be brought to a decision maker’s attention. In policy analysis, the research hypotheses may define a process to be created or improved, or recommend alternative actions for a decision maker. Examples of research hypotheses:
- Economic instability indicated by a drop of 10% in annual Gross Domestic Product (GDP) will lower the political satisfaction in the state by 20% or more.
- As the United States and Canada are both democracies, they will not resort to violent conflict to resolve disagreements over Gulf of Maine fishing rights.
- G-20 developed states will continue to exploit undeveloped states in Africa to obtain their labor and raw materials at a 50% lower cost than other world regions.
- Being a member of the NATO alliance, the United States faces a 50% greater likelihood of going to war against Russia.
Operational definitions. These definitions encompass a set of procedures designed to establish the existence, or degree of existence, of a phenomenon (variable, concept). The analyst seeks to measure variables based on his/her operational definitions in order to test a research hypothesis. The measures may necessitate the objective measurement of the variables or concepts—using the five senses or technical measurement instruments. Often the analyst is faced with defining an intersubjective variable, whereby even though the variable cannot be observed directly (i.e., objectively with the senses or technical instruments); if people agree the variable exists, they can devise a way to measure it (e.g., how it applies to concepts such as love, fear, hate, trust, etc.). Another type of widely used variable measurement is a proxy variable. In this case, if the analyst cannot obtain the measure of a variable with the senses or technical instruments, the measurement of another related variable or concept may be substituted; this assumes that the second variable has the same approximate range and distribution as the original variable. For example, per capita income is often used as a proxy variable to substitute for quality of life. Operational definitions must delineate unique qualities of the variables or attributes without over- or under- generalizing. More information on measuring variables is covered later in this chapter. Table 3.3 provides examples of several operational definitions (as related to the previously listed theoretical concepts):
Figure 3.3 | Examples of Operational Definitions | |
Variable/Concept | Operational Definition | |
Economic Instability | Unexpected drop or gain in Gross Domestic Product (proxy variable) | |
Political Satisfaction | Voting Results or Survey Findings (intersubjective variable) | |
Democracies | Freedom House Annual Freedom-in-the- World Numerical Ratings (index measure) | |
Developed State/Developing States | Per Capita Income Levels (proxy variable) | |
Labor/Raw Materials Costs | Measures of Actual Costs (actual measures) | |
Alliance Member | Existing Treaties or Agreements (actual measure) | |
War | More than 1,500 Casualties On One Side in One Year (discipline standard) | |
Variables. In working with theoretical propositions and research hypotheses, it is important to understand independent variables and dependent variables.9 The distinction between independent and dependent variables is particularly relevant when determining cause-effect relationships, when assessing assumptions (Chapter 6), and whenever the study employs structural causal models (Chapter 7). The independent variable is what man or nature manipulates. Independent variables designate treatments, programs, or causes. The dependent variable is what is affected by the independent variable. Dependent variables thus indicate the effects or outcomes caused by an independent variable. For example, if studying the effects of an alternative crop-substitution program on the amount of illegal drugs a state produces, the crop-substitution program is the independent variable and the amount of illegal drugs the state produces is the outcome or dependent variable.
In addition to independent and dependent variables, the analyst may encounter other designations for variables such as antecedent and intervening variables. An antecedent variable occurs before the independent variable and, in effect, makes the independent variable its own dependent variable. An intervening variable occurs between an independent and dependent variable and is effectively an independent variable. In security literature, the term “variable” may not be used; instead, the analyst will encounter terms such as “factors” or “drivers.” In effect, factors and drivers are the same as independent variables. Figure 3.4 demonstrates a hypothetical structural-causal model showing the relationships among variables.
As seen in Figure 3.4, depicting structural-causal models is complex. There are procedures in statistical analysis to solve these complex models, provided quantitative measurements of each variable are available. This book focuses more on simplified structural-causal models, which are less complex and can be solved using qualitative methods (Chapters 7 and 9). This simplification—including only the most important variables in a model—is known as employing parsimony, which is commonly stated as “KISS—Keep It Simple Sailor (or Soldier)!” Quantitative studies rely heavily on parsimony to identify the most important variables in a model, while qualitative and comparative studies may address more variables and more complex models.
Causality. In developing theoretical propositions and testing research hypotheses, it is critical to follow the rules of causality.10 These rules often are misused in social science and security analysis. Whether reviewing the literature (Chapter 5), assessing key assumptions (Chapter 6), or building causal models (Chapter 7), it is necessary to continually assess compliance with the rules of causality. These rules include:
There must be time-ordering. The independent variable movement or change must occur before the movement or change in the dependent variable, even if only a nanosecond before.
There must be co-variation. The independent and dependent variables must move together. Once the independent variables move up or down (increases or decreases or changes categories), the dependent must follow by also moving up or down or changing categories. If both variables move together in the same direction it is a direct relationship. If one moves up and the other moves down, it is an indirect relationship.
There must not be a spurious relationship. There cannot be a third variable that causes both the independent and dependent variables to move together. The classic but unverifiable example is a German story offering how one year an increase in storks coincided with an increase in human births. On its face, this was not a good causal relationship because storks do not play a role in increasing human births (except in fairy tales). In this case, it was the result of an unusually cold winter in Germany that presented good conditions for both stork and human breeding. Thus, the cold winter was a third variable that created a spurious relationship. Identifying spurious relationships can be challenging even for experienced analysts.
There must be a theory. This is a decidedly positivist view; but, there needs to be a theory that explains the relationships among the independent and dependent variables before they may be included in any cause-effect statements.
Wheel of Science. Science normally is taught in academic programs as depicted in Figure 3.5, which outlines a systematic process used by researchers to create knowledge. The Figure 2.5 Security Analysis Critical-Thinking Framework used throughout this book is consistent with the Figure 3.5 wheel of science, but also adds a number of expanded critical-thinking elements crucial in conducting good security analysis.
In using the wheel of science, it is assumed the findings will answer the research questions and added to the knowledge base on the topic under investigation. In academic circles, it is also assumed the findings will generate new research questions, which will then start another study following the wheel-of- science process. Thus, for academics, the wheel of science is in continuous movement.
Research Design
The research design step in Figure 3.5 is of critical importance to the scientific process because it establishes the analyst’s overall plan to test the study’s hypotheses.11 This includes the operationalization of variables and considerations for:
- Planning the logical reasoning approach to adopt in the study.
- Designating what type of study will be attempted (qualitative, comparative, or quantitative—see discussion below).
- Determining the level(s) of analysis.
- Deciding how variables will be measured.
- Designating which sampling method(s) will be utilized.
- Delineating data collection and data analysis procedures (Chapters 5 and 9, respectively).
- Determining how biases in the study will be reduced in order to achieve reliability and validity in the findings.
These research design elements are addressed in more detail below and in subsequent chapters.
Induction and deduction. In determining the logical reasoning approach to be attempted in a study, the analyst must first decide if it will follow the inductive approach or deductive approach. Another confusing definitional situation surrounds the concepts of induction and deduction.12 Table 3.6 provides an overview of the differences in these concepts in relation to their use in reasoning and research. Unaided judgment used widely in the security community prior to 9/11 (Chapter 1) employed mainly the Table 3.6 induction research approach. Scientific research, including security analysis as explained in this book, is based mainly on the below Table 3.6 deductive research approach.
Beyond induction and deduction, the literature sometimes will mention abduction as another logical reasoning approach. In some circles, this is considered a blending of induction and deduction. In abduction, hypotheses are generated by first assessing the existing facts in a case and then using logical reasoning to test the hypotheses and develop a plausible finding or conclusion. This process does not provide a finding that is particularly verifiable and thus can lack validity. Abduction also has been defined as generating hypotheses whose consequences can be derived by deduction and evaluated by induction.13 Security analysts might want to keep abduction in mind when there is reason to believe a certain causal pre-condition can explain the findings and time is limited to investigate beyond this pre-condition.14 Overall, abduction is not as consistent or systematic as deduction and violates several of the elements of critical thinking; therefore, it should be used with caution as the findings may not be verifiable.
Figure 3.6 | Induction and Deduction Defined | |
Reasoning Definition | Research Definition/Approach | |
Induction | Reasoning that leads to findings/conclusions based in probability (findings are likely, probable, etc.). | Starts with the information (data, facts, and evidence) already collected or about to be collected. Using facts and logic, works from the information to the findings/conclusions. Grounded Theory may be created through inductive research methods. Induction is the common research approach used by journalists and historians. |
Deduction | Reasoning that leads to findings/conclusions considered not refutable (i.e., findings are the verifiable truth). (See later discussion on debate between Free Will versus Determinism.) | Starts with the existing knowledge or theory on the issue, develops hypotheses/alternatives and a research design to test the hypotheses/alternatives using logical reasoning. Additional data collection and analysis then test the hypotheses/alternatives that lead to the findings/conclusions. This is the Scientific Method used in both the natural and social sciences. |
Reliability and validity. The ultimate goal of most research, academic or practitioner, is to find the “truth” about the research topic (or to get as close to the truth as possible). The truth is often an elusive concept when dealing with social science research. Humans do not always behave in the same way in similar situations, which creates problems for truth-finding. Instead of speaking about the truth, professional analysts tend to discuss and assess their work in terms of its reliability and validity.15 Reliability and validity apply equally to practitioners and academics, although practitioners often do not use these terms. The terms reliability and validity are used throughout this book and are defined as:
Reliability. If a study is reliable, it means another analyst can use the same research procedures (theory, hypotheses/alternatives, sampling methods, data collection methods, analysis methods, etc.) and generate the same results. As Heuer commented on unaided judgment, pre-9/11 intelligence analysis often was kept in the heads of the analysts and could not be checked for reliability or validity (Chapter 1).
Validity. If a study is valid, it means the analyst actually studied the concepts the research question and research design specified. Achieving validity focuses on reducing biases. Validity in security studies is best defined by a combination of three general sub-categories:
Construct Validity means the analyst adequately conceptualized and operationalized (measured) the research variables, process steps, and/or agency model’s contents (Chapter 7).
Internal Validity means the analyst properly specified structural causal, process, or agency models. It assumes the analyst included the most important variables (factors, drivers) in their model and excluded variables of little or no importance (Chapters 7 and 8).
External Validity means the analyst used a proper research design (sampling, data collection, data analysis) such that the research findings may be inferred not only to the case(s) studied, but also to a larger population (Chapter 9).
Levels of analysis. Achieving research reliability and validity assumes that analysts employ the proper level of analysis.16 To address this, analysts must be clear as to whether they are studying individuals, groups, or groups-of-groups, as defined by the levels of analysis specified in the research question and research design. Research results cannot be generalized or inferred to a level of analysis not actually studied (i.e., theorized about and data collected on). Using the wrong level of analysis results in major degradations to the study’s external validity. When the analysts draw their research conclusions from a level of analysis other than the one studied, it results in an ecological fallacy.17 For example, if the research focuses on collecting and analyzing data on individuals, the findings cannot then be generalized to how groups made up of these individuals will act.
Table 3.7 summarizes the levels of analysis commonly addressed by different social science academic disciplines. During their careers, political- military analysts—whether engaged in either intelligence analysis or security policy analysis—will find a need to work at several different levels of analysis, sometimes even within the same research project. Analysts may need to access the theories of several academic disciplines shown in Table 3.7, while avoiding the ecological fallacy by making sure their data collection and analysis matches the level of analysis specified in their research questions and research design.
Figure 3.7 | Common Levels of Analysis and Academic Discipline | |
Level of Analysis | Academic Discipline | |
International Systems | International Relations | |
Political Systems | Political Science | |
Economic Systems | Economics | |
Cultures | Anthropology | |
Social Groups (large & small) | Sociology | |
Individuals | Psychology | |
Research biases. To achieve reliability and validity, the analyst must reduce research biases, which means strict compliance with social science research procedures. The use of triangulated or multi-method studies assists in reducing potential biases. Triangulated studies often use alternative theories, alternative hypotheses, alternative data-collection methods, and alternative data-analysis techniques to create multiple research designs to determine if the same results are obtained using alternative methods. Multi-method (or mixed-method) studies may combine qualitative, comparative, or quantitative studies (discussed in more detail below).18 Use of triangulated and multi-method studies generally reduce biases and improve the reliability and validity of research findings. Triangulated or multi-method studies are all but mandatory for good practitioner security analysis; but, also should be strongly considered for academic studies.
All analysts have differing values, ideologies, perceptions, emotions, etc., which influence the way they see and interpret the world. A first step in reducing biases is recognizing they exist. In other words, the analysts must recognize, assess, and overcome their own blind-spot biases (see Figure 2.3). The analyst’s ontology, or view of how the world works, is a major source of research bias. Theorists considering themselves realists (conservatives), idealists (liberals), Marxists, post-modernists, constructivists, structuralists, etc., approach research with different views of how the world works, meaning they employ different assumptions and generate different perceptions of how the world works. Descriptions of these different approaches to research are usually found in academic course work or in security literature. Several of these approaches and their key assumptions are discussed in more detail in Appendix III.
Positivists, no matter which theoretical approach they follow, usually look at the world of social practice through one of two distinct perspectives, either the “etic” or “emic” approaches.19 An analyst using the etic approach stands outside the world of social practice and observes human behavior from afar without becoming deeply involved or interacting personally with the subjects under observation. For example, a political scientist using empirical data collected by others or who conducts surveys of the research subjects is employing the etic approach. An analyst using the emic approach literally enters the world of social practice and observes human behavior while closely interacting with the research subjects. For example, an anthropologist who goes to live with a recently identified indigenous group is employing the emic approach. Both etic and emic analysts see the world of social practice through different—but still biased— lenses, such that their perspectives are heavily influenced or biased by their own belief systems and experiences. Most security-related research and analysis utilizes the etic approach; however, at times, human intelligence collectors or policy analysts (Chapter 5) may take an emic approach on their observations.
Whether using the etic or emic approach, value-free or unbiased research is nearly impossible to find, even if the analyst recognizes and accounts for their blind-spot bias, so analysts should anticipate critiques of their findings. It is far better for the analyst to point out the weaknesses in their own findings than have someone else later criticize the work. If the biases are fatal, it may be best for the analyst to rethink their analytic process or even take on a different project. Luckily that is not usually the case. In most instances, biases exist, but the findings are nonetheless valuable if interpreted with the appropriate caveats in mind. A good rule for any research project is to sensitize the reader to those caveats. Another good rule is to disclose limitations with the study’s research design to the customer or reader.
To systematically discuss the problems of bias a research project may include, it is helpful to consider three main issues:20
Nature of the bias. What is the source of the bias? Many analysts use income as an operational definition of quality of life. But income from a person's occupation may not be their only source of monetary resources. There is also income from stocks and bonds, from other investments, from rental property, from retirement programs, and so on. It can therefore be said that occupational income is a biased measure of quality of life. (Or, alternatively, that wages are not a true picture of wealth.)
Direction of the bias. What is the likely effect of the bias? How does the bias affect the advancement or testing of alternative hypotheses? For example, the direction of the bias associated with the above income variable is to underestimate quality of life.
Magnitude of the bias. How large is the effect of the bias? This is the most difficult question to answer. Indeed, if the size of the bias was actually known, then the analyst could correct the estimates accordingly and be rid of the problem. In most cases all the analyst can do is plausibly speculate on the magnitude of the bias. In the income case, for example, it is plausible to argue the magnitude of the bias is small. Why? Because in most populations, very few people who are in the labor force have other sources of income. Hence, one could argue that the bias is likely to be small, allowing the analyst to proceed with the analysis.
Analytic goals, aims, and objectives. Figure 3.8 provides a summary of the goals, aims, and objectives a security analyst should consider from the start of the analytic project. To comprehend Figure 3.8, the definitions of the three different types of research in the top column—qualitative, comparative, and quantitative— must be considered as the research design is in development. This does not mean the type of research design will remain unchanged as the project advances, but the initial research design type should be considered during the project’s development process. Each of the three types of research calls for its own data collection and data analysis techniques. See the expanded discussion of data collection and analytic techniques in Chapters 5 and 9, respectively.
Figure 3.8 | Analytic Goals, Aims, and Objectives21 | |||
Analytic Goals, Aims, Objectives | Qualitative Research Design | Comparative Research Design | Quantitative Research Design | |
Identify Broad Patterns | S | S | P | |
Test/Refine Theory (Conceptualization) | S | S | P | |
Advance Theory (Conceptualization) | P | P | S | |
Make Predictions (Threat and Opportunity Analysis) | S | S | P | |
Interpret Significance (What Does This Mean?) | P | S | S | |
Explore Diversity | S | P | S | |
Give Voice | P | S | S | |
Develop Policy Alternatives | P | S | S | |
P = Primary Use, S = Secondary Use
Qualitative research. This type of research design is used when studying many aspects (20 or more) of a few cases (1-10 as a rule). In this type of research, the analyst looks for commonalities among the cases. Qualitative data collection methods (Chapter 5) generally include literature searches, content analyses, unobtrusive measures collection, participant-observations, interviews, and focus groups. The analysis includes coding concepts found in the data collected, and then uses the coded data to support, or not support, the study’s hypotheses. Descriptive statistics usually support qualitative research. Forms of logical argumentation normally are employed in qualitative analysis. The objective of this type of analysis is to use descriptive inference to test the study’s hypotheses and find common patterns (Chapter 9). The vast majority of security analysis consists of case studies using qualitative research techniques.
Comparative research. These research design is employed when studying a moderate number of aspects (15-20 variables) of a moderate number of cases (approximately 11-50). Comparative research looks for diversity in cases and data collection may include any of the methods used in either qualitative or quantitative studies, although they might not always work well. There are some specific analytic methods used in comparative research, including use of truth tables and fuzzy-set analysis. The objective of comparative analysis is to use methods of descriptive inference to test the study’s hypotheses and find patterns of diversity. Comparative research techniques are especially pertinent when conducting regional analyses studying conditions in several nearby states.
Note: Most books on research methods limit their coverage to only qualitative and quantitative methods, as comparative methods are a narrow sub-field of research and analysis. When discussing comparative research, there is also a definitional problem. To most social scientists, comparative research means the use of comparative analysis methods discussed above, which are not as well- known as qualitative and quantitative methods. To a comparatist in U.S. political science, comparative research means studying any political system outside the United States.
Quantitative research. This type of research design is used when studying a few aspects (approximately 1-15 variables) of many cases (usually 50 or more). The objective of quantitative analysis is to use methods of statistical inference to test the study’s hypotheses. Quantitative research looks for the strength of relationships among variables. Fewer than 50 cases may be addressed if the data analysis techniques used generate acceptable statistical significance values. Quantitative data collection may include qualitative collection techniques, but it is more commonly conducted using survey results or other methods to gather statistical data on numerous cases. Both descriptive statistics and more complex statistical methods generating statistical inference are commonly used in the analysis of quantitative data. Chapter 9 contains more detail on statistical significance.
Referring to Figure 3.8, note the left column identifies a number of analytic goals, aims, and objectives common to security analysis and designates the type of research design (primary or secondary) to accomplish them. The analyst should consider which of these analytic goals, aims, and objectives, plus research design types, provide the “best fit” for their project. One project may have multiple analytic goals, aims, and objectives that include:
Identify broad patterns. To identify broad patterns in social phenomenon is a primary objective of social science and, to do so with statistical significance is the purview of quantitative research. Qualitative and comparative research may identify social patterns, but the likelihood and confidence levels in the results will be less than for a quantitative study. Chapter 11 includes an expanded discussion of likelihood and confidence levels.
Test/refine theory (conceptualization). All analytic projects require a theory or model. This is part of conceptualizing the study. The only exception to using a model or theory may be when the research is descriptive in nature (Chapter 4 contains an expanded discussion of descriptive studies). When explaining or predicting social behavior, a theory or model is absolutely required. Because of problems with generating significance (likelihood, confidence levels) when using qualitative and comparative techniques, quantitative studies are the best approach for testing and refining theories. Analysts conducting quantitative studies; however, often have problems with conceptualization as they have not searched deep enough into the social behavior to have adequately built their theoretical models and thus have problems with construct validity and internal validity. Quantitative studies should be preceded by qualitative and comparative studies to advance (develop) theory as discussed below; utilizing this process helps ensure theories or models are adequately developed.
Advance theory (conceptualization). Qualitative and comparative studies have a major role in initially developing or advancing theory. An analyst attempting to explain or predict social behavior must develop a theory or model, and then use their data collection and analytic techniques to test their hypotheses. But, be careful! No matter how strong the correlations (co- variations) analysts uncover in their qualitative or comparative study hypothesis tests, there remains the problem of establishing the results’ likelihood and confidence levels. The best approach is to advance (develop) theories or models using a qualitative or comparative study, then develop a data collection plan to test the theory or model using quantitative techniques.
Make predictions (threat and opportunity analysis). Predicting future social behavior presents a major challenge to security analysts. Even with a perfect data collection situation, which is seldom the case, social beings (humans) have free will and may not act in the future the same way as they acted in the past. Making predictions is a main activity of intelligence analysts as they conduct threat and opportunity analyses, and they have a number of techniques to generate results. Quantitative statistical analyses play a primary role in predicting variables where there are large databases to employ statistical or other mathematical tests. Since predictive qualitative and comparative analysis techniques are not taught widely in universities, academics tend to struggle with predictive analysis. Because of the usual lack of large databases available in the field of security analysis, most predictive studies are carried out using qualitative or comparative techniques.
Interpret significance. After a major international or domestic event, policy makers and decision makers often ask “what does this mean?” Security analysts, both practitioners and academics, may frequently find themselves trying to interpret the significance of current events and other human behavior, decisions, and conditions. Qualitative studies work best for interpreting significance.
Explore diversity. Comparative research techniques are designed to explore diversity over a moderate number of cases. Qualitative studies tend to focus more on uncovering commonalities in a smaller number of cases. Quantitative studies focus on finding broad patterns in a larger number of cases. Comparative techniques, such as truth tables and fuzzy-set analyses, bridge the gap between qualitative and quantitative research and are available for highlighting the diversity across a number of cases.
Give voice. This means to analyze and present information and findings on a hidden or otherwise not widely known population. For example, during the 1980s as Middle East conflict became a more prevalent topic in U.S. security, there was little knowledge among the general public of the differing Islamic Sunni and Shi’ite sects and the conflicts between them. Over the next two decades, both government and journalistic analysis “gave voice” to these Islamic sects and made the differences between them more universally known to both security analysts and the public. There are many other examples where populations hovering below-the-radar or those newly found were given voice in security analysis.
Develop policy alternatives. Developing policy alternatives is the most important activity of policy analysts. It is also the most complex type of analysis. Policy analysts do not want to present obvious or little-researched recommendations to the policy maker or decision maker. Instead, there must be a robust, critical-thinking analysis that provides a range of alternative solutions. Most alternative development is conducted using qualitative techniques, but comparative and quantitative techniques also may play a role (Chapters 8 and 9).
Measuring Variables. A major source of bias affecting construct validity is whether variables are properly measured. Proper measurement includes having good, specific operationalized definitions of variables. Part of operationalizing a variable is considering how the variable will be measured and data collected.22 There are four levels of measurement used in operationalizing variables. It is important to clearly understand the distinctions among these levels, because each type of measurement requires its own specific qualitative, comparative, or statistical analytic techniques to test hypotheses.
Nominal. A nominal scale of measurement is a set of categories varying in content, but not in magnitude. Nominal is the crudest measure of a variable. For example, the variable U.S. political parties would be measured on a nominal scale, with measures (categories) such as Republican, Democrat, Independent, Green, or others. State of residence is a nominal variable; as are gender, race, and religion. A special type of nominal variable is the dichotomous “dummy” variable, where the existence of the concept or variable is measured as a “1,” and the lack of existence is measured as a “0.” This 1/0 dichotomy is important in several comparative and statistical techniques for testing hypotheses.
Ordinal. An ordinal scale of measurement is when the values of a variable can be assessed by a level of magnitude, but the degrees of magnitude are not defined or of equal intervals. After nominal variables, ordinal variables are the next crudest in measurement level. There is an ordering of the values on an ordinal scale, but the distances between the values do not have a precise numerical meaning. Examples include: high, medium, and low-social trust; upper, middle, and lower-class; (left to right orientation) liberal, moderate, or conservative-political attitudes; and responses to a question in the form of ‘very favorable,’ ‘favorable,’ ‘indifferent,’ ‘unfavorable,’ ‘very unfavorable.’ For these types of variables, there is a clear ordering of the categories, but the absolute distance between the categories is not specified.
Note: Nominal and ordinal measured variables also are referred to as “categorical” variables or incorrectly as “qualitative” variables.
Interval. In addition to incorporating order of magnitude, interval variables have a specific numerical distance between and within each level of measurement. Hence, the analyst can compare values not only in terms of which is larger than another, but also in terms of how much larger. What interval-measured variables lack is a set zero point. When rating scales or indexes are developed and used to measure an interval variable, they often have the lowest value measured as a one (1) and not a zero (0). For example, Freedom House publishes an annual rating scale of “Freedom in the World” consisting of two expert-generated indexes assessing political rights and civil liberties in most world states. Both of these indexes use measurements of 1 (best) to 7 (worst). Adding these two indexes provides an accepted interval measure of the variable democracy.23 Interval- measured variables often are used in statistical procedures as if they do have a set zero point, but such use adds bias to the findings.
Ratio. Ratio-level variables have the same characteristics as interval variables, but also have a set zero point. Age, centigrade temperature, miles per hour, etc., are examples of ratio variables with a set zero point. Ratio variables allow the use of the most complex and robust statistical-analysis procedures for testing hypotheses.
Note: Interval- and ratio-measured variables are also referred to as “continuous,” “quantitative,” or “scale” variables.
The specificity of variable measurements may be arranged on a continuum from high to low, with ratio the highest and nominal as lowest. Figure 3.9 summarizes the four levels of variable measurement. Obtaining ratio-measured variables is the best approach in any study as they provide the most information and allow the most robust statistical procedures. The level of measurement of a variable; however, will depend on its operational definition and the ability to collect information on the variable. The analyst can opt to convert ratio variables to more imprecise measurements such as interval, ordinal, or ratio. One cannot; however, convert a nominal- or ordinal-measured variable to one that is higher on the Figure 3.9 list.
Figure 3.9 | Summary of Variable Measurements | ||||
Levels of Measurement {high to low) | Place in discreet categories | Rank order the categories | Equal intervals between/within categories | Set zero (0) point exists | |
1. Ratio | X | X | X | X | |
2. Interval | X | X | X | ||
3. Ordinal | X | X | |||
4. Nominal | X | ||||
Sampling Theory
Proper sampling allows an analyst to use data drawn from a small portion of a population to infer patterns or behaviors existing in the larger population.24 Proper sampling helps ensure reliability and validity in a study, with a special emphasis on external validity. There are frequent examples in both practitioner reports and academic studies where improper sampling degrades the external validity and adds significant bias to a study’s findings. Poor sampling is a major contributor to the Part-to-whole informal logic fallacy (Appendix I), where analysts attempt to use a smaller-than-required sample to improperly generalize to a larger population. Proper sampling must be considered, whether the analyst is reviewing the literature or designing their own research project. Normally, when analysts talk about proper sampling, they are referring to quantitative studies. This book presumes proper sampling methods apply to the full range of empirical qualitative, comparative, and quantitative research. To obtain samples in quantitative studies, which can be used to test hypotheses or for other analytic objectives, the analyst must consider both the size of the sample and the randomness of how the data was collected. The nature of qualitative and comparative studies limits the analyst to using smaller samples and thus usually restricts the findings from being generalized to a larger population. There are two types of sampling methods normally used in qualitative, comparative, or quantitative studies: probability methods and non-probability methods.
The basics of sampling are depicted in Figure 3.10, where the analyst selects a sample from a larger population. If the sample is selected properly, the analyst can study the sample and then infer (generalize) the larger population will exhibit the same patterns, behaviors, relationships, opinions, etc., found in the sample. This provides the foundation for finding patterns in the data. If the sample is selected improperly, the analyst is unable to make accurate inferences back to the larger population. Inference can be characterized as either descriptive (for small samples) or statistical (for large samples).
Sampling definitions. Sampling has specific vocabulary, including:
Units of analysis. Entails the actual units included in a population or sample. Similar to levels of analysis, the unit of analysis more specifically defines which individuals, groups, cultures, systems, cases, etc., will be included in the study’s sample.25
Population. Identifies all the units of analysis whose behavior or relationships the analyst selects to generalize about.
Census. A list including every unit of analysis in the population (also called a sampling frame).
Sample. Identifies the units of analysis selected and data collected and analyzed in the actual research.
N (number). The number of units of analysis in a sample.
Figure 3.11 provides a list of questions an analyst should ask before selecting either a probability or non-probability sampling method.
Figure 3.11 | Analyst’s Pre-Sampling Questions |
| |
Probability sampling methods. These methods normally are used in quantitative studies with large samples.26 Probability sampling is based on the laws of mathematical probability. The Central Limit Theorem (CLT) offers that, if a sample is taken randomly and of sufficient size from a population, the descriptive statistics of individual variables in the sample (i.e., mean, mode, median, range, distribution, variance, etc.) will approach the tendencies of the same variables in the larger population. The CLT also offers that, the larger the sample taken or the more samples taken from the same population, the closer the sample’s statistical tendencies will be to that of the population. As depicted in Figure 3.10, the CLT allows analysts to test hypotheses using only a single sample and then to make generalizations from the sample back to the larger population. There are three main types of probability samples governed by the CLT—simple random, systematic, and stratified.
Simple, random samples. Taking simple, random samples is the most accurate probability sampling method and should be used whenever possible. To take a simple, random probability sample, the analyst must have a numbered sampling frame of the entire population (i.e., a listing of units of analysis such as a census list, school roster, tax roll, election roll, etc.).27 If the sampling frame does not have sequential numbers, the analyst must create or assign them. Using a random number table or a random number generator program, the analyst selects which units or cases from the sampling frame will be in the sample. The goal of this method is to make sure every unit in the population has an equal probability of selection as part of the sample. The equal probability of selection method (EPSM) is what analysts strive to ensure in all probability samples.28
In security analysis, a good sample should generate a 95% confidence level with a 5% confidence interval. The 95% confidence level means the analyst is willing to be wrong 5% of the time (or 1 in 20 times), which is normally acceptable in security analysis. The 5% confidence interval means the actual value of the sample statistic computed will be somewhere plus or minus 5% of the statistic calculated. For example, if a proper EPSM sample of the population is taken to find support for a candidate for political office and the results show 60% support with a 5% confidence interval, the actual support is likely between 55% and 65% (plus or minus 5% of 60%--sometimes called the sampling error or margin). There are statistical equations for calculating the confidence level and confidence interval for different sample sizes. To make it easier for security analysts, Figure 3.12 provides a summary of the size of the population and number required in the sample to achieve a 95% confidence level with a 5% confidence interval.
Figure 3.12 | Sample Size for 95% Confidence Level & 5% Confidence Interval | |
Number of Units in Population: | Number of Units Required in Sample (N): | |
50 | 44 | |
100 | 80 | |
250 | 152 | |
500 | 217 | |
1,000 | 278 | |
5,000 | 357 | |
50,000 | 381 | |
1 million | 384 | |
300 million | 384 | |
As a standard rule, large-sample quantitative studies should strive for a sample size of at least 400 units. To obtain a 95% confidence level with a 3% confidence internal, most studies take a sample of 1,500 units when researching large populations of a million or more. The analyst may use the Sample Size Calculator to compute the exact sample size for any size population.
Note: Researchers must be aware of frequently encountered self-selected samples where the respondent is given a choice whether to participate. Many surveys are completed by telephone using a random number generator to select telephone numbers to be called. The problem with the random-number process is that callers can decline to participate, so survey teams must usually call many more potential respondents to reach the intended number of responses (units) desired for the sample. Because this adds bias to the results; i.e., the sample is not truly random, the analyst should justify use of a self-selected sample to the customers or readers of the final study.
Systematic sampling. When the analyst only possesses an unnumbered sampling frame, a systematic sampling method is an accepted probability sampling method used to achieve EPSM.29 For example, if the analyst only has a telephone book as a sampling frame, the following procedures would provide an EPSM sample:
- Determine how many pages there are in the telephone book and how many average entries there are on each page.
- Use a random number table or random number generator to select: (1) a start page, (2) where on the start page the analyst will begin selecting the sample, and (3) how many numbers on that page or how many pages will be skipped until the next selection (depending on how many units are needed in the final sample).
Note: When using a systematic sample, make sure there are no recurring patterns in the sampling frame. For example, if in the sampling frame every 15th entry was a female and the systematic sampling strategy called for the analyst to select every 15th person; then, if the sample started with a female, the final sample could be all females, even though the sampling frame may contain half males and half females. Therefore, checking the sampling frames for recurring patterns is important whenever employing the systematic sampling method.
Stratified sampling. A third accepted EPSM probability-sampling method may be used when the analyst decides to ensure sub-populations (substrates) important to the study are included in the final sample.30 For example, if only 30% of the population is Hispanic, a stratified sample would ensure the final sample contains 30% Hispanics. To conduct a stratified sample:
- Determine the sub-populations in the population that are important to the study. If the analyst is not sure of the importance of sub-populations to the study, he/she should use simple random or systematic sampling methods instead.
- Determine the proportions (percentages) of the sub-populations in the population. Do this by dividing the population into these sub-populations and then randomly sample within each sub-population (see example below).
Note: Using more than 2 or 3 sub-populations can make stratified sampling very complex and can take considerable time and money to complete. Also, sampling within each sub-population selected creates its own confidence-interval sampling errors (that are additive), which if not accounted for in the final analysis can ruin the generalizability to the larger population.
Stratified sampling example: An analyst selects a population consisting of 50% male, 50% female, 30% Hispanic, and 70% non-Hispanic and decides to employ a stratified sampling method, which results in representative numbers of the sub-populations. The population is 1,000,000 and the analyst desires a sample size of 400 (to achieve a 95% confidence level with a 5% confidence interval). To visualize this, create a table similar to Figure 3.13, designating the sub-populations and their proportions in the population. Cross multiply to obtain the proportion and number of units needed in each sub-population (i.e., .50 male X .30 Hispanic = .15; then .15 X 400 = 60 male/Hispanics in this sub-population). Then randomly sample each sub-population until the numbers desired are obtained.
Note: If there is a 5% confidence interval in the sampling of each of the sub- populations in this example, the total confidence interval in Figure 3.13 could be 20% (5% X 4 for the 4 sub-populations), a confidence level not acceptable in most scientific research.
Figure 3.13 | Stratified Sampling Example | |||
Population = 1 million | Male (.50) | Female (.50) | ||
Hispanic (.30) | .50 X .30 = .15 or 60 in sample | .50 X .30 = .15 or 60 in sample | .30 X 400 = 120 total Hispanics in sample | |
Non-Hispanic (.70) | .50 X .70 =.35 or 140 in sample | .50 X .70 = .35 = or 140 in sample | .70 X 400 = 280 total non-Hispanics in sample | |
.50 X 400 = 200 males in sample | .50 X 400 = 200 females in sample | 400 total in sample | ||
Non-probability sampling methods. These types of sampling methods should not be used in quantitative studies. Non-probability sampling methods; however, are commonly used in qualitative and comparative studies when it is too cumbersome or too costly to use probability sampling methods.31 When using non-probability methods, the analyst must always be aware there will be a resultant negative effect on the study’s reliability and validity. The uncertainty that goes along with generalizing from a non-probability sample is one reason why qualitative and comparative studies may only “advance” theories and not “test” theories, as can be done with quantitative studies. Non-probability samples often are referred to as non-representative, so unless the analyst is very careful in using and justifying non-probability samples, others may challenge the ability to generalize a study’s findings to the larger population. This is especially true where quantitative analysts use a non-probability method and disregard the sample sizes in Figure 3.12. The best advice for overcoming problems with non-probability sampling methods is to either find a way to employ a probability sampling method or increase the sample size until the same results start being collected from multiple units. Non-probability sampling methods include: cluster sampling, quota sampling, purposive or judgmental sampling, snowball sampling, and haphazard or convenience sampling.
Cluster sampling. This is a non-probability method used when there is not a convenient sampling frame. In cluster sampling, the analyst looks for natural groups or “clusters” of units of analysis, such as by geographic region, organizations, schools, etc., and then uses EPSM techniques within the clusters to select the sample.32 For example, if the analyst wants to sample U.S. Muslim citizens, he/she would look for their sample at locations frequented by Muslims (mosques, community centers, etc.). The key with cluster sampling is to maximize the between-group variances in the individual variables. Some research methodologists consider cluster sampling an acceptable EPSM technique, similar in some ways to stratified sampling. If cluster sampling is used, the analyst is responsible for justifying its use to the customers or readers of the final study.
Quota sampling. This is a non-probability method that is similar to the stratified probability method. In quota sampling, instead of using the natural proportion of sub-populations in the larger population, the analyst decides the proportion of differing sub-populations to use in the final sample.33 Unless well justified by the analyst, use of quota sampling violates EPSM and can lead to major reliability and validity issues.
Purposive or judgmental sampling. This type of sampling is a non- probability sampling method used regularly in qualitative and comparative studies where descriptive (versus statistical) inference is employed. In this method, the analyst selects a sample of units that will provide the information needed. In other words, the analyst looks for units of analysis that will serve the purpose of the study.34 This is also sometimes called the expert choice sampling method, with the expert being either the analyst or the expert respondent in the sample. The analyst must be careful in selecting units with this sampling method to ensure there is variance in the dependent and independent variables across the selected units. Using the purposive or judgmental sampling method normally allows the analyst to generalize to the units in the sample and not to a larger population. When using this type of sampling, it is recommended to keep collecting data until new information is no longer being uncovered.
Snowball sampling. This is a non-probability method where the analyst builds the sample by asking persons (units) already sampled for location data on other units having the expertise or characteristics desired for the study.35 This method is especially useful when there is not a good sampling frame and where the analyst is not sure where units that meet the study’s needs are located. This is similar to the technique used by detectives or investigators as they build leads in a case and then follow-up on each lead to generate additional leads. Use of the snowball sampling method allows the analyst to generalize to the units in the sample and not to a larger population.
Haphazard or convenience sampling. This sampling method is a non- probability sampling method considered the last option the analyst should consider using. With this method, the analyst simply selects a sample of those units that are readily available.36 For example, standing in a shopping mall and asking every 10th person passing to complete a survey is a haphazard or convenience sample, which does not adequately support generalizations to a larger population, unless the study’s population is people in the shopping mall in that location and on that day. Using a haphazard or convenience sampling method only allows the analyst to generalize to the units in the sample and not to a larger population. The best advice is to avoid haphazard or convenience sampling.
The Great Debates
While there are a number of basic foundational concepts in scientific research accepted widely in social science, there remain a number of “great debates” among analysts and scholars with differing research perspectives. These debates are found in security analysis literature just as they are in the larger social science literature. A summary of the main debates related to security analysis is provided below.
Historicism versus behaviorism. This debate first arose in the 1950s and 1960s. Previously, most social science scholarship was based on historical analyses that employed the historical or inductive method. In these historical analyses, scholars would use logical reasoning, case studies, and analogies to identify broad political, economic, and social patterns, which they could then use to describe, explain, and/or predict social behavior. During the 1950s and 1960s; however, Austrian neurologist Sigmund Freud’s psychoanalysis theories were being expanded and adopted by most social science disciplines. Additionally, emerging computing technology allowed social scientists to test theories using statistical procedures applied to large databases—something that was more difficult when all statistical procedures were done by hand. The behaviorist approach, which adopted both psychological theory and quantitative methods using computers, began to flourish by the late-1960s. When Heuer identified unaided judgment as the primary methods employed in pre-9/11 intelligence analysis (Chapter 1), he was highlighting how the intelligence community was employing a historicist or inductive approach to analysis.37 The behaviorist approach won the historicism versus behaviorism scholarly debate as academic researchers sought to make their work more scientific. The Director of National Intelligence even directed that intelligence analysis become more systematic,38 which coincides with the behaviorist approach. Both historicist and behaviorist works still are being produced in the social sciences, including in security analysis, by both practitioners and academics. This book stresses the behaviorist approach to analysis.
Art versus science. There remains debate over whether security analysis is more art or science.39 Being labeled an art implies the work tends to be based on the imagination and creativity of individual analysts or groups of analysts, which are developed as an analyst gains experience. Thus, the art side argues experience combined with imagination and creativity are needed to generate the best security analysis findings. The science side of this debate offers that the best analysis is produced using the systematic procedures included in the scientific method. The science side also recognizes the need for experienced analysts to both conduct and lead analytic efforts, provided scientific methods are being employed. This book addresses both the art and science approaches to security analysis. The Figure 2.5 Security Analysis Critical-Thinking Framework is based on a synthesis of the scientific method and critical thinking. Art is infused in this framework as imagination and creativity may be used in accomplishing any of the Figure 2.5 elements. This is particularly true of the alternatives element where this book provides several basic creative-thinking techniques to generate unique and useful alternatives to expand the range of alternative hypotheses and scenarios investigated in a study (Chapter 8).
Descriptive inference versus statistical inference. To quantitative analysts, the “gold standard” has been the calculation of statistical significance, which supports statistical inference of their analytic findings to a larger population. Statistical inference provides a measure of the strength of relationships between variables (i.e., the strength of the analyzed patterns). To quantitative analysts, analytic procedures where statistical significance cannot be determined are of little value. To counter this hardened stance on statistical inference, a second type of inference was championed, known as descriptive inference. If the scientific method is used in a qualitative study to investigate a valid research question, descriptive inference may be used to establish causal relationships and thus advance social theory.40 This concept applies equally to comparative studies where statistical significance is also usually missing. The idea of descriptive inference thus gives qualitative and comparative analyses greater standing and acceptance in the scientific community. The security community takes descriptive inference to an even higher level by ensuring analysts develop likelihood and confidence levels for their analytic results (Chapter 11), whether using qualitative, comparative, or quantitative methods.
Empirical theory versus normative theory. Empirical theory is developed using the methods of social science introduced in this chapter where the tenets of empiricism and rationalism are combined. To develop and test empirical theory, analysts must be able to demonstrate the actual relationships among variables under study. Normative theory; on the other hand, offers theoretical relationships that “ought to be” or “should be.” Normative theory is closely related to values and ethics, defining what is right or wrong, just or unjust, or desirable or undesirable in society. Normative theory cannot usually be tested because the conditions needed to empirically test the theory do not exist. For example, the liberal Democratic-Peace Theory is normative because it explains how the world “ought” to be more peaceful with the spread of democracy, a condition that does not yet substantially exist world-wide, so it cannot be fully tested. Likewise, theories derived from the Marxist approach are often normative in the sense that they offer the human condition “ought” to be improved when socialism becomes the world economic system and is combined with a communist governing system—conditions not existing so they cannot be tested. Theories derived from the liberal, Marxist, and post-modern approaches often are normative as they rationalize about individual human, group, state, or international system conditions that “ought to” or “should” exist but currently do not. Security analysts must be aware of whether they are employing or creating empirical or normative theories in their studies.
Agent versus structure. Social science literature is replete with differing perspectives arising from the agent versus structure debate.41 Supporters of the agency side of this debate argue it is the agent, meaning the decision maker or group of individuals making decisions, who must be analyzed to explain behavior. Agency proponents downplay the role of structure or institutions in influencing decisions. For example, agency advocates argue that Adolph Hitler bears primary responsibility for starting World War II in Europe and not the military, political, and economic conditions that existed in 1920s and 1930s Europe. Structural advocates, on the other hand, offer it is the surrounding structure (laws, treaties, rules, regulations, conditions, etc.) that influences behavior—thus the key decision makers are of lesser importance—in other words the behavior will still occur no matter who is the decision maker. Using the World War II example again, structuralists argue the rise of Hitler was secondary, as the real reason for World War II in Europe could be found in the 1920s and 1930s European military, political, and economic conditions largely created by the Versailles Treaty ending World War I. Recognizing most situations have both agency and structural aspects is a major challenge to security analysts as they should consider and include, as appropriate, both agency and structural models in conceptualizing their studies. Chapters 6 and 7 provide additional details on agency and structural modeling.
Free will versus determinism. In this debate, one side argues human behavior is the result of human “free will” where people are free to act or make different decisions in similar situations. The other side of this debate argues free will is not as important a factor, but human behavior is instead “determined” by the surrounding structure or from past observations of the behavior. Using the deductive approach, social science inference views the world as probabilistic, as analytic findings seldom receive 100% confidence levels, so they will have a probability of being wrong. There are few, if any, deterministic (100%) propositions in social science. The best an analyst can do is demonstrate the strength of relationships among variables and identify the probabilistic parameters concerning the inference of the findings to a larger population. This clearly differs from the definition of deductive reasoning depicted in Figure 3.6. In quantitative studies, the statistical significance provides the probabilistic estimate. In qualitative and comparative studies, security analysts assign likelihood and confidence levels to allow the customer or reader to understand the probabilities associated with the findings.
Explaining versus understanding. Among academic positivists, the central activity of social science is to explain human behavior as answers are generated to research questions by asking “why” and “how” (Chapter 4). Explaining is usually associated with the etic approach to research, where the analyst stands outside the world of social practice and attempts to explain an observed social behavior. Scholars who do not accept the positivist view offer that the scientific method may not be used to study human behavior. These non-positivists downplay the need to explain social behavior and see their main purpose as one of understanding the behavior from the perspectives of the humans studied, which is more akin to the emic approach where the analyst enters the world of social practice. Those who see their role as understanding, including humanists, constructivists, and other post-modernist academic approaches, try to empathize with the humans under study and understand reality as do their subjects. These non-positivist approaches often dispute the role of social theory and the ability to find patterns in human behavior, and instead see every unit of analysis or case as having its own distinct features where research can; at best, understand the behavior. In this book, the scientific approach is preferred; but, when addressing the elements of point of view and assumptions (Chapter 6), the analyst must also strive for a deeper understanding of the behavior under study.
Key Concepts
Abduction
Antecedent Variable
Applied Research
Assumptions
Axioms
Behaviorism
Biases
Causality
Census
Comparative Research
Construct Validity
Deduction
Dependent Variable
Descriptive Inference
Determinism
Direct Relationship
Ecological Fallacy
Emic
Empirical Theory
Epistemology
Equal Probability of Selection
Emic Method
Etic
External Validity
Free Will
Grounded Theory
Induction
Independent Variable
Indirect Relationship
Internal Validity
Interval Variable
Intersubjective Variable
Intervening Variable
Grounded Theory
Historicism
Laws
Levels of Analysis
Logical Reasoning
Multi-Method Studies
N (sample size)
Nominal Variable
Non-Probability Sampling
Normative Theory
Observation
Ontology
Operational Definition
Ordinal Variable
Parsimony
Population
Positivists
Postulates
Probability Sampling
Proxy Variable
Pure Research
Qualitative Research
Quantitative Research
Ratio Variable
Reliability
Research
Research Design
Research Hypothesis
Sampling Frame
Sampling Theory
Science
Self-Selected Samples
Statistical Inference
Theorems
Theoretical Concepts
Theorizing
Triangulated Studies
Unit of Analysis
Validity
Wheel of Science
Discussion Points
- Considering the seven categories of epistemology, are there other methods for gaining knowledge? Estimate the percentage of your existing knowledge that can be attributed to each of the seven epistemological categories.
- Do a quick search for information on Democratic-Peace Theory. Identify five theoretical propositions in this theory. Are these propositions assumptions, axioms, theorems, postulates, or laws? Why?
- Why is deduction the preferred approach to logical reasoning for use in security analysis?
- Find a published study or national survey that used a probability sampling method. How well did this study or survey comply with the equal probability of selection method (EPSM)? Critique the study’s or survey’s stated confidence level and confidence interval.
- Find a published study that employed a non-probability sampling method. Critique the measures this study used to reduce biases. Could a probability sampling method have been used? Why or Why Not? What is the generalizability of the study’s results? Did the author generalize properly?
Notes
1 H. Russell Bernard, Social Research Methods, Qualitative and Quantitative Approaches (Thousand Oaks, CA: Sage, 2000), 8-9.
2 The epistemological origins of knowledge vary depending on the social science or philosophy references consulted. This list is a synthesis of several sources on epistemology and was originally published in Michael W. Collier, “A Pragmatic Approach to Developing Intelligence Analysts,” Defense Intelligence Journal 14, no. 2 (2005), 19.
4 Walter G. Peacock, (graduate research methods course lecture, Florida International University, spring 1998).
5 Earl Babbie, The Practice of Social Research, Instructor’s Edition (Belmont, CA: Thomson Wadsworth, 2007), 55-56.
6 Peacock.
7 David S. Geller and J. David Singer, Nations at War, A Scientific Study of International Conflict (Cambridge, U.K.: Cambridge University Press, 1998), 113-139.
8 Bernard, 36-38.
9 Ibid, 33-34.
10 Babbie, 90-91; Bernard, 53.
11 John W. Creswell and J. David Creswell, Research Design, Qualitative, Quantitative, and Mixed-Methods Approaches 5th ed. (Thousand Oaks, CA: Sage, 2018), 11-15.
12 Babbie, 49-51.
13 Joseph M. Williams and Gregory G. Colomb, The Craft of Argument, 3rd ed. (New York: Pearson Longman, 2007), 235-242, referenced in Katherine Hibbs Pherson and Randolph H. Pherson, Critical Thinking for Strategic Intelligence (Thousand Oaks, CA: Sage/CQ Press, 2017), 155.
14 Pherson and Pherson, 155.
15 Babbie, 143-148; Bernard, 46-49.
16 Level of analysis is often used interchangeably with the term “unit of analysis.” See Babbie, 94-99.
17 Bernard, 46.
18 Creswell and Creswell, 213-243.
19 Babbie, 291-293.
20 Modified from Charles H. Wood, “Social Statistics,” (unpublished manuscript, Center for Latin American Studies, University of Florida, 2003).
21 Charles C. Ragin and Lisa Amoroso, Constructing Social Research, The Unity and Diversity of Method, 3rd ed. (Thousand Oaks, CA: Sage, 2019). 48.
22 Babbie, 44-46; Bernard, 38-41.
23 Freedom House, “Freedom in the World 2019, Democracy in Retreat” (Richmond, VA: Freedom House, 2019). https://freedomhouse.org/report/freedom-world/freedom-world- 2019/democracy-in-retreat (accessed July 1, 2018).
24 Gary T. Henry, Practical Sampling (Newbury Park, CA: Sage Publications, 1990), 10-12.
26 Bernard, 147.
29 Ibid, 149-150.
30 Ibid, 151-153.
31 Henry, 17.
32 Bernard, 154-158.
33 Ibid, 174-176.
34 Ibid, 176-178.
35 Henry, 21.
36 Bernard, 178-179.
37 Richards J. Heuer, Jr. “Taxonomy of Structured Analytic Techniques,” (paper presented at the annual meeting of the International Studies Association, San Francisco, CA, March 26-29, 2008), 3-4.
38 Office of the Director of National Intelligence, “Analytic Transformation, Unleashing the Potential of a Community of Analysts,” (Washington, DC: September 2008), 17.
39 Stephen Marrin, Improving Intelligence Analysis, Bridging the Gap Between Scholarship and Practice (New York: Routledge, 2011), 21-52; and Richard L. Kugler, Policy Analysis in National Security Affairs, New Methods for a New Era (Washington, DC: National Defense University Press, 2006), 14.
40 Gary King, Robert O. Keohane, and Sidney Verba, Designing Social Inference, Scientific Inference in Qualitative Research (Princeton, NJ: Princeton University Press, 1994), 8.
41 Harry D, Gould, “What is at Stake in the Agent-Structure Debate?” in Vendulka Kubalkova, Nicholas Onuf, Paul Kowert, eds. International Relations in a Constructed World (Armonk, NY: M.E. Sharpe, 1998), 79-98.